Introduction to GeoPanadas#
A considerable proportion of the data generated every day is inherently spatial. From Earth Observation data and GPS data to data included in all kinds of maps, spatial data –also known sometimes as geospatial data or geographic information– are data for which a specific location is associated with each record.
There are many tools suited for geospatial data science. In this notebook, we will focus on how to use the GeoPandas library to work with geospatial data. We will learn how to read, write, and manipulate geospatial data using GeoPandas. We will also learn how to visualize geospatial data using GeoPandas, as well as some basic geospatial operations such as spatial joins.
Basics of GeoPandas#
GeoPandas, as its name suggests, is an extension of the pandas library that helps you work with geospatial data.
The main data structures in geopandas are GeoSeries and GeoDataFrame which extend the capabilities of Series and DataFrames from pandas.
The main difference between geodataframes and pandas dataframes is that a geodataframe should contain one column for geometries. By default, the name of this column is 'geometry', which contains the geometries (points, lines, polygons, multipolygons etc.).

Install Geopandas:#
To avoid complexities, GeoPandas recommends installing the library using the conda package manager.
conda install geopandas
Reading spatial data#
To read spatial data, GeoPandas comes with the geopandas.read_file() function. This function can automatically read most of the occurring vector-based spatial data.
Some of the most common vector data formats are:
Shapefile. As the industry standard, shapefiles are the most common vector data format.
GeoJSON. It’s a newer format for geospatial data released in 2016. Unlike shapefiles, GeoJSON is a single file, making it easier to work with.
Reading from a shapefile:#
import geopandas as gpd

gdf = gpd.read_file('path/to/shapefile.shp')
Reading from a GeoJSON file:#
import geopandas as gpd

gdf = gpd.read_file('path/to/geojson.geojson')
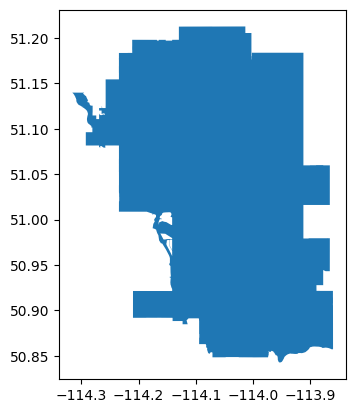
As an example, let’s load the boundaries for the City of Calgary which you can have access to it in the City of Calgary Open Data Portal.
We have the data as shape file (.shp), so we only need to call the data:
# import GeoPandas
import geopandas as gpd


# reading the shapefile
boundary = gpd.read_file('City_Boundary.shp')

boundary = boundary[['CITY', 'geometry']]
boundary
| CITY | geometry | |
|---|---|---|
| 0 | CALGARY | POLYGON ((-114.01328 51.21243, -114.01327 51.2... |
# display the type of the dataframe
type(boundary)
geopandas.geodataframe.GeoDataFrame
# display the first rows of the dataframe
boundary.head()
| CITY | geometry | |
|---|---|---|
| 0 | CALGARY | POLYGON ((-114.01328 51.21243, -114.01327 51.2... |
boundary.info()
<class 'geopandas.geodataframe.GeoDataFrame'>
RangeIndex: 1 entries, 0 to 0
Data columns (total 2 columns):
 #   Column    Non-Null Count  Dtype
---  ------    --------------  -----
 0   CITY      1 non-null      object
 1   geometry  1 non-null      geometry
dtypes: geometry(1), object(1)
memory usage: 148.0+ bytes
As we can see, the geometry column has Dtype of “geometry” which is a special data type in GeoPandas. It is used to store the spatial data. The geometry column contains the polygon data for each community district. The polygon data is used to draw the boundaries of the community districts on the map.
Reading from a CSV file:#
When reading from a CSV file, you need to create a GeoDataFrame from a DataFrame by specifying the geometry column.
Depending on your data, if you have a latitude and longitude column, you can create a geometry column from them using the gpd.points_from_xy function.
If you have a WKT column, you can create a geometry column from it using the gpd.GeoDataFrame function.
If you have line or polygon geometries, you can create a geometry column from them using the gpd.GeoDataFrame function.
For example, if you read a point CSV file with columns lon and lat and you want to create a GeoDataFrame from it, the geometry column can be created from lon and lat coordinates using the gpd.points_from_xy function.
import geopandas as gpd

gdf = gpd.read_file('path/to/csv.csv')
gdf = gpd.GeoDataFrame(gdf, geometry=gpd.points_from_xy(gdf.lon, gdf.lat))
Note
Take a look at GeoPandas documentation for more examples: https://geopandas.org/en/latest/gallery/create_geopandas_from_pandas.html
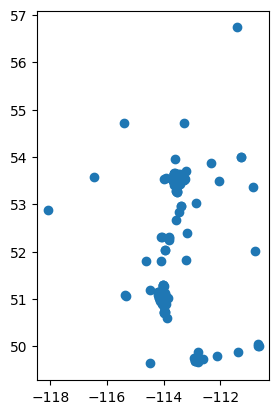
Now, let’s imagine that we have a tex or csv file that includes points with latitude and longitude column. In this case, after loading the data, we have to define the geometry column from the latitude and longitude columns.
In this example, we are going to load the dataset of a list of COVID-19 and flu vaccination locations in Canada.
(Link to the dataset.)
import geopandas as gpd

# reading the csv file
vaccination_location = gpd.read_file('Vaccination_Locations.csv')
Let’s look at the data:
# display the top 3 rows of the dataframe
vaccination_location.head(3)
| Address1 | Address2 | City | Phone | VaccineType | latitude | longitude | Take Home Test Kits | Antiviral Confirmed | Title | |
|---|---|---|---|---|---|---|---|---|---|---|
| 0 | 104-375 ST. ALBERT TR | ST ALBERT | 780-458-8000 | ADULT XBB | 53.64320444 | -113.6226777 | YES | NO | LONDON DRUGS #48 | |
| 1 | 601-401 COOPERS BLVD SW | AIRDRIE | 587-254-5810 | ADULT XBB | 51.25705871 | -114.0210533 | YES | YES | SAVE-ON-FOODS PHARMACY #6603 - AIRDRIE WEST | |
| 2 | 110-10 PELICAN PL | SYLVAN LAKE | 403-864-5192 | ADULT XBB | 52.29941313 | -114.0959723 | YES | YES | PELICAN PLACE PHARMACY |
As we can see, the geometry column contains None values. This is because the geometry column is empty and we need to fill it with the correct geometry values. We can do this by using the latitude and longitude columns to create a Point geometry. We can use the following code to create a Point geometry from the latitude and longitude columns and fill the geometry column with the correct geometry values.
# create a geometry column
vaccination_location['geometry'] = gpd.points_from_xy(vaccination_location['longitude'], vaccination_location['latitude'])

# display the top 3 rows of the dataframe
vaccination_location.head(3)
| Address1 | Address2 | City | Phone | VaccineType | latitude | longitude | Take Home Test Kits | Antiviral Confirmed | Title | geometry | |
|---|---|---|---|---|---|---|---|---|---|---|---|
| 0 | 104-375 ST. ALBERT TR | ST ALBERT | 780-458-8000 | ADULT XBB | 53.64320444 | -113.6226777 | YES | NO | LONDON DRUGS #48 | POINT (-113.62268 53.6432) | |
| 1 | 601-401 COOPERS BLVD SW | AIRDRIE | 587-254-5810 | ADULT XBB | 51.25705871 | -114.0210533 | YES | YES | SAVE-ON-FOODS PHARMACY #6603 - AIRDRIE WEST | POINT (-114.02105 51.25706) | |
| 2 | 110-10 PELICAN PL | SYLVAN LAKE | 403-864-5192 | ADULT XBB | 52.29941313 | -114.0959723 | YES | YES | PELICAN PLACE PHARMACY | POINT (-114.09597 52.29941) |
As we can see, the vaccination_location dataframe now has a geometry column that contains the Point objects. We can now convert the dataframe into a GeoDataFrame.
# convert the dataframe to a GeoDataFrame
vaccination_location = gpd.GeoDataFrame(vaccination_location, geometry='geometry')

# display the info of the geodataframe
vaccination_location.info()
<class 'geopandas.geodataframe.GeoDataFrame'>
RangeIndex: 188 entries, 0 to 187
Data columns (total 11 columns):
 #   Column               Non-Null Count  Dtype
---  ------               --------------  -----
 0   Address1             188 non-null    object
 1   Address2             188 non-null    object
 2   City                 188 non-null    object
 3   Phone                188 non-null    object
 4   VaccineType          188 non-null    object
 5   latitude             188 non-null    object
 6   longitude            188 non-null    object
 7   Take Home Test Kits  188 non-null    object
 8   Antiviral Confirmed  188 non-null    object
 9   Title                188 non-null    object
 10  geometry             188 non-null    geometry
dtypes: geometry(1), object(10)
memory usage: 16.3+ KB
Exploring GeoDataFrames#
WE saw that the geometry column can contain any type of vector data, such as points, lines, and polygons.
Another important feature of GeoDataFrames is that every geometry comes with associated CRS information. This CRS information tells GeoPandas where the coordinates are located on Earth. This information is key for spatial analysis. For example, if you need to combine two spatial datasets, you need to make sure they are expressed in the same CRS. Otherwise, you won’t get the result you expected.
There are two main categories of CRS:
Geographic coordinates. They define a global position in degrees of latitude and longitude relative to the equator and the prime meridian. With this system, we can easily specify any location on earth. It is used widely, for example, in GPS. The most popular CRS is EPSG:4326, also called WGS84.
Projected coordinates. While Earth is round, we usually represent it on a two-dimension map. Projected coordinates express locations in X and Y dimensions, thereby allowing us to work with a length unit, such as meters, instead of degrees, which makes the analysis more convenient and effective. However, moving from the three-dimensional Earth to a two-dimensional map will inevitably result in distortions. That’s why there are different approaches to creating projected coordinates. For example, many countries have adopted a standard projected CRS for their particular geography.
Hint
There’s much more about CRS, but it’s out of the scope of this tutorial. To find out additional information about projection and CRS you can take a look at Geopandas documentation.
In GeoPandas, the CRS information is stored in the crs attribute:
# get the crs of the boundary geodataframe
boundary.crs
<Geographic 2D CRS: EPSG:4326>
Name: WGS 84
Axis Info [ellipsoidal]:
- Lat[north]: Geodetic latitude (degree)
- Lon[east]: Geodetic longitude (degree)
Area of Use:
- name: World.
- bounds: (-180.0, -90.0, 180.0, 90.0)
Datum: World Geodetic System 1984 ensemble
- Ellipsoid: WGS 84
- Prime Meridian: Greenwich
As we can see, the crs of the boundary geodataframe is ‘Geographic 2D CRS: EPSG:4326’.
Now let’s see the crs of the vaccination_location geodataframe.
# get the crs of the vaccination_location geodataframe
vaccination_location.crs
We can see that the vaccination_location geodataframe does not have a crs. This is because the csv file does not contain the crs information. We can set the crs of the vaccination_location geodataframe to the crs of the boundary geodataframe using the to_crs method.
In this way, we can ensure that both the geodataframes have the same crs so that we can perform spatial operations such spatial join, overlay, etc.
# set the crs of the vaccination_location geodataframe to the crs of the boundary geodataframe
vaccination_location.crs = boundary.crs

#display the crs of the vaccination_location geodataframe
vaccination_location.crs
<Geographic 2D CRS: EPSG:4326>
Name: WGS 84
Axis Info [ellipsoidal]:
- Lat[north]: Geodetic latitude (degree)
- Lon[east]: Geodetic longitude (degree)
Area of Use:
- name: World.
- bounds: (-180.0, -90.0, 180.0, 90.0)
Datum: World Geodetic System 1984 ensemble
- Ellipsoid: WGS 84
- Prime Meridian: Greenwich
Now both dataframes have the same crs, we can proceed to the next steps.
Plotting the geometries#
It is always a good idea to plot the geometries to see if they are correctly placed on the map. We can use the plot() method to plot the geometries of the geodataframes.
# plot the boundary geodataframe
boundary.plot()
<Axes: >
# plot the vaccination_location geodataframe
vaccination_location.plot()
<Axes: >
From previous turtoials, you are familiar with folium. Now, lets use folium to plot the boundary and vaccination_location geodataframes
boundary
| CITY | geometry | |
|---|---|---|
| 0 | CALGARY | POLYGON ((-114.01328 51.21243, -114.01327 51.2... |
import folium

# create a map object with Calgary latitude and longitude as the center
m = folium.Map(location=[51.0447, -114.0719], zoom_start=10)

# plot the boundary geodataframe
folium.GeoJson(boundary).add_to(m)

# plot the vaccination_location geodataframe
for idx, row in vaccination_location.iterrows():
    folium.Marker([row['latitude'], row['longitude']]).add_to(m)

# display the map
m
Spatial Relationships with GeoPandas#
One of the key aspects of geospatial data is how they relate to each other in space. GeoPandas leverages the power of pandas and shapely packages to perform all kinds of spatial relationships between spatial datasets. In this section, we will cover some of the most common operations.
Spatial Joins#
Spatial joins allow the merging of two GeoDataFrames based on their spatial relationships.
In GeoPandas, the spatial join operation is available as the sjoin() function. The first argument we specify is the GeoDataFrame to which we want to add information, and the second argument is the GeoDataFrame that contains the information we want to add. Then, we have to specify the type of join. Finally, the parameter “predicate” tells GeoPandas which spatial relationship we want to use to match both datasets. Some of the most common relationships “intersects”, “contains”, and “within”.
Note
You can refer to https://geopandas.org/en/stable/gallery/spatial_joins.html for more information about spatial join.
For example, let’s say that we want to find the vaccination locations that are within the city boundary. We can use the sjoin method to perform a spatial join between the two geodataframes. The sjoin method will return a new geodataframe with the vaccination locations that are within the city boundary.
# perform a spatial join between the boundary and vaccination_location geodataframes
vaccination_location_within_boundary = gpd.sjoin(vaccination_location, boundary, predicate='within')
vaccination_location_within_boundary
| Address1 | Address2 | City | Phone | VaccineType | latitude | longitude | Take Home Test Kits | Antiviral Confirmed | Title | geometry | index_right | CITY | |
|---|---|---|---|---|---|---|---|---|---|---|---|---|---|
| 5 | 113-5271 MEMORIAL DR SE | CALGARY | 403-235-0081 | 51.05308993 | -113.9562593 | YES | NO | UNIVERSAL PHARMACY | POINT (-113.95626 51.05309) | 0 | CALGARY | ||
| 8 | 11-3735 RUNDLEHORN DR NE | CALGARY | 403-798-9280 | ADULT XBB | 51.07151283 | -113.97887 | YES | YES | RUNDLE PHARMACY | POINT (-113.97887 51.07151) | 0 | CALGARY | |
| 15 | 850 SADDLETOWNE CIR NE | CALGARY | 403-293-1670 | 51.12375399 | -113.9447021 | YES | NO | FRESHCO PHARMACY #4291 | POINT (-113.9447 51.12375) | 0 | CALGARY | ||
| 16 | 3130-11 ROYAL VISTA DR NW | CALGARY | 403-800-6646 | ADULT XBB | 51.1500556 | -114.2064574 | NO | NO | CALGARY DRUG MART #03 | POINT (-114.20646 51.15006) | 0 | CALGARY | |
| 25 | 400-1000 HAMPTONS DR NW | CALGARY | 403-299-6715 | ADULT XBB | 51.14347029 | -114.1295243 | YES | YES | CALGARY CO-OP PHARMACY #17 | POINT (-114.12952 51.14347) | 0 | CALGARY | |
| 27 | 771 NORTH MOUNT DR NW | CALGARY | 403-454-5244 | ADULT XBB | 51.08260367 | -114.0959373 | YES | NO | MELL PHARMACY | POINT (-114.09594 51.0826) | 0 | CALGARY | |
| 30 | 114-8180 MACLEOD TR SE | CALGARY | 403-253-7383 | ADULT XBB | 50.98199571 | -114.0703651 | YES | YES | MEDICINE SHOPPE PHARMACY 111 | POINT (-114.07037 50.982) | 0 | CALGARY | |
| 32 | 108-5401 TEMPLE DR NE | CALGARY | 403-460-0303 | ADULT XBB | 51.0851268 | -113.9569255 | YES | NO | TEMPLE MEDICAL CLINIC PHARMACY | POINT (-113.95693 51.08513) | 0 | CALGARY | |
| 35 | 32-4604 37 ST SW | CALGARY | 825-210-9716 | 51.01325442 | -114.1399128 | YES | NO | RUTLAND COMPOUNDING PHARMACY | POINT (-114.13991 51.01325) | 0 | CALGARY | ||
| 36 | 4-7930 BOWNESS RD NW | CALGARY | 403-288-4041 | ADULT XBB | 51.08913208 | -114.2011653 | YES | YES | MEDICINE SHOPPE PHARMACY 199 | POINT (-114.20117 51.08913) | 0 | CALGARY | |
| 37 | 356-100 ANDERSON RD SE | CALGARY | 403-271-7877 | 50.95353734 | -114.0667463 | NO | YES | SHOPPERS DRUG MART #316 | POINT (-114.06675 50.95354) | 0 | CALGARY | ||
| 41 | 860 13 ST SE | CALGARY | 587-480-0178 | ADULT XBB | 51.04042942 | -114.0309414 | YES | YES | SAGE PLUS CLINICAL PHARMACY | POINT (-114.03094 51.04043) | 0 | CALGARY | |
| 47 | 1711 4 ST SW | CALGARY | 403-228-5067 | ADULT XBB | 51.0372509 | -114.0717656 | YES | YES | RIDEAU PHARMACY | POINT (-114.07177 51.03725) | 0 | CALGARY | |
| 48 | 11-600 CROWFOOT CRES NW | CALGARY | 403-455-9939 | ADULT XBB | 51.12979307 | -114.2039427 | YES | YES | MEDICINE SHOPPE PHARMACY 260 | POINT (-114.20394 51.12979) | 0 | CALGARY | |
| 51 | 2079 146 AVE SE | CALGARY | 403-278-1565 | ADULT XBB | 50.9198697 | -114.0148617 | YES | YES | DRUG SHOPPE | POINT (-114.01486 50.91987) | 0 | CALGARY | |
| 58 | 240-520 3 AVE SW | CALGARY | 403-454-4412 | 51.0507308 | -114.0688522 | YES | YES | MEDIMAX PHARMACY | POINT (-114.06885 51.05073) | 0 | CALGARY | ||
| 65 | 8855 MACLEOD TR SW | CALGARY | 403-640-7617 | ADULT XBB | 50.97449255 | -114.0719797 | YES | NO | SAVE-ON-FOODS PHARMACY #6634 | POINT (-114.07198 50.97449) | 0 | CALGARY | |
| 66 | 1219 11 AVE SW | CALGARY | 587-392-5857 | ADULT XBB | 51.04319727 | -114.0900798 | YES | NO | PHARMASAVE JO'S BELTLINE PHARMACY | POINT (-114.09008 51.0432) | 0 | CALGARY | |
| 73 | 7-2111 CENTRE ST NW | CALGARY | 403-276-7076 | ADULT XBB | 51.07131481 | -114.0629897 | YES | NO | EXALAN PHARMACY | POINT (-114.06299 51.07131) | 0 | CALGARY | |
| 81 | 159 MAHOGANY CENTRE SE | CALGARY | 403-299-5808 | ADULT XBB | 50.89697308 | -113.9348758 | YES | YES | CURIS RX PHARMACY MAHOGANY | POINT (-113.93488 50.89697) | 0 | CALGARY | |
| 83 | 7048-2060 SYMONS VALLEY | PKWY NW | CALGARY | 403-266-1450 | ADULT XBB | 51.17595078 | -114.10752 | YES | NO | FRESHCO PHARMACY #4311 | POINT (-114.10752 51.17595) | 0 | CALGARY |
| 90 | 4122 BRENTWOOD RD NW | CALGARY | 403-299-4308 | 51.08844285 | -114.1308792 | YES | YES | CALGARY CO-OP PHARMACY #4 | POINT (-114.13088 51.08844) | 0 | CALGARY | ||
| 97 | 109-5809 MACLEOD TR SW | CALGARY | 403-460-3825 | ADULT XBB | 51.00187606 | -114.0724615 | YES | NO | HEALTH WAY PHARMACY | POINT (-114.07246 51.00188) | 0 | CALGARY | |
| 102 | 78-4307 130 AVE SE | CALGARY | 403-475-8612 | ADULT XBB | 50.93059254 | -113.9730717 | NO | YES | SOUTH TRAIL PHARMACY | POINT (-113.97307 50.93059) | 0 | CALGARY | |
| 106 | 100-2675 36 ST NE | CALGARY | 403-291-0076 | ADULT XBB | 51.07748805 | -113.9825869 | NO | YES | MEDICINE SHOPPE PHARMACY 171 | POINT (-113.98259 51.07749) | 0 | CALGARY | |
| 110 | 114-10325 BONAVENTURE DR SE | CALGARY | 403-271-8160 | 50.96051322 | -114.0697877 | YES | YES | NULIFE PHARMACY | POINT (-114.06979 50.96051) | 0 | CALGARY | ||
| 111 | 103A-3009 14 ST SW | CALGARY | 403-764-3080 | ADULT XBB | 51.02730152 | -114.0950098 | YES | YES | PHARM DRUGSTORE | POINT (-114.09501 51.0273) | 0 | CALGARY | |
| 114 | 4700 130 AVE SE | CALGARY | 403-257-6530 | ADULT XBB | 50.93356613 | -113.9668006 | NO | YES | LOBLAW PHARMACY #1546 | POINT (-113.9668 50.93357) | 0 | CALGARY | |
| 122 | 101-83 DEERPOINT RD SE | CALGARY | 587-554-5588 | ADULT XBB | 50.9268828 | -114.0289032 | NO | YES | DEER VALLEY PHARMACY | POINT (-114.0289 50.92688) | 0 | CALGARY | |
| 125 | 200 STEWART GREEN SW | CALGARY | 403-246-0336 | ADULT XBB | 51.01460372 | -114.1670197 | NO | NO | SAFEWAY PHARMACY #8852 | POINT (-114.16702 51.0146) | 0 | CALGARY | |
| 129 | 100-250 SHAWVILLE BLVD SE | CALGARY | 403-299-4439 | ADULT XBB | 50.90319486 | -114.0637289 | YES | YES | CALGARY CO-OP PHARMACY #14 | POINT (-114.06373 50.90319) | 0 | CALGARY | |
| 131 | 9-15 MILLRISE BLVD SW | CALGARY | 587-329-5858 | ADULT XBB | 50.9205757 | -114.076119 | NO | YES | MILLRISE PHARMACY | POINT (-114.07612 50.92058) | 0 | CALGARY | |
| 141 | 128-6707 ELBOW DR SW | CALGARY | 403-259-6893 | ADULT XBB | 50.99368257 | -114.0840543 | YES | NO | MAYFAIR PHARMACY | POINT (-114.08405 50.99368) | 0 | CALGARY | |
| 145 | 7-1603 62 AVE SE | CALGARY | 587-391-9878 | ADULT XBB | 50.99746705 | -114.020351 | YES | NO | OGDEN PHARMACY | POINT (-114.02035 50.99747) | 0 | CALGARY | |
| 149 | 9-728 NORTHMOUNT DR NW | CALGARY | 403-289-9181 | ADULT XBB | 51.08230306 | -114.09281 | YES | YES | CAMBRIAN PHARMACY | POINT (-114.09281 51.0823) | 0 | CALGARY | |
| 152 | 104-305 10 ST NW | CALGARY | 825-540-1500 | ADULT XBB | 51.05451586 | -114.0862431 | YES | YES | HEATHERS PHARMACY | POINT (-114.08624 51.05452) | 0 | CALGARY | |
| 156 | 4940 RICHMOND RD SW | CALGARY | 403-299-4487 | ADULT XBB | 51.01911946 | -114.1589891 | NO | YES | CALGARY CO-OP PHARMACY #6 | POINT (-114.15899 51.01912) | 0 | CALGARY | |
| 158 | 110-8500 BLACKFOOT TR SE | CALGARY | 403-253-5700 | ADULT XBB | 50.97661519 | -114.046636 | YES | YES | MEADOWS MILE PHARMACY | POINT (-114.04664 50.97662) | 0 | CALGARY | |
| 161 | 105-4411 16 AVE NW | CALGARY | 403-247-9502 | ADULT XBB | 51.06805148 | -114.1588588 | YES | NO | MEDICINE SHOPPE PHARMACY 178 | POINT (-114.15886 51.06805) | 0 | CALGARY | |
| 162 | 125-8888 COUNTRY HILLS BLVD NW | CALGARY | 403-239-7455 | 51.15178225 | -114.2131886 | YES | NO | SOBEYS PHARMACY #1129 | POINT (-114.21319 51.15178) | 0 | CALGARY | ||
| 164 | 2790 32 AVE NE | CALGARY | 403-453-2443 | ADULT XBB | 51.08199601 | -113.9952041 | YES | YES | UNITED PHARMACY | POINT (-113.9952 51.082) | 0 | CALGARY | |
| 169 | 700-2220 68 ST NE | CALGARY | 403-299-2612 | ADULT XBB | 51.0684625 | -113.9336307 | YES | YES | CALGARY CO-OP PHARMACY #15 | POINT (-113.93363 51.06846) | 0 | CALGARY | |
| 173 | 6213 CENTRE ST NW | CALGARY | 403-274-2444 | ADULT XBB | 51.10788492 | -114.0633693 | YES | YES | SANDSTONE PHARMACIES SIMONS VALLEY | POINT (-114.06337 51.10788) | 0 | CALGARY | |
| 178 | 1010 1 AVE NE | CALGARY | 403-269-6440 | ADULT XBB | 51.05342892 | -114.0401932 | NO | NO | BRIDGEDALE PHARMACY | POINT (-114.04019 51.05343) | 0 | CALGARY | |
| 184 | 4501 BRISEBOIS DR NW | CALGARY | 403-282-1208 | ADULT XBB | 51.09340467 | -114.127905 | YES | YES | PHARMASAVE ON NORTHMOUNT | POINT (-114.1279 51.0934) | 0 | CALGARY | |
| 185 | 100-5005 DALHOUSIE DR NW | CALGARY | 403-202-0444 | ADULT XBB | 51.10549355 | -114.1612934 | YES | YES | SAFEWAY PHARMACY #8844 | POINT (-114.16129 51.10549) | 0 | CALGARY | |
| 186 | 2303 4 ST SW | CALGARY | 403-229-3458 | ADULT XBB | 51.03231993 | -114.0718985 | YES | YES | MEDICINE SHOPPE PHARMACY 194 | POINT (-114.0719 51.03232) | 0 | CALGARY | |
| 187 | 28 PANATELLA BLVD NW | CALGARY | 403-460-6707 | ADULT XBB | 51.16547718 | -114.0712342 | NO | YES | PANORAMA HILLS PHARMACY | POINT (-114.07123 51.16548) | 0 | CALGARY |
# plot the new vaccination_location_within_boundary geodataframe and the boundary geodataframe with folium

# create a map object with Calgary latitude and longitude as the center
m = folium.Map(location=[51.0447, -114.0719], zoom_start=10)

# plot the boundary geodataframe
folium.GeoJson(boundary).add_to(m)

# plot the vaccination_location_within_boundary geodataframe
for idx, row in vaccination_location_within_boundary.iterrows():
    folium.Marker([row['latitude'], row['longitude']]).add_to(m)

# display the map
m
As we can see, the vaccination_location_within_boundary geodataframe contains the vaccination locations that are within the boundary of Calgary. We can now use this geodataframe to find the vaccination locations within Calgary. the spatial join operation is a very useful operation in geospatial analysis. It can be used to find the points that are within a polygon, the polygons that intersect with another polygon, and many other spatial operations.
Summary#
I hope you enjoyed this GeoPandas tutorial. Spatial analysis is one of the coolest domains in data science, providing endless opportunities to enrich your analysis with location-based information. There are many tools for spatial analysis, but if you’re already familiar with Python, GeoPandas is a great place to get started.